Introduction
A change-point analysis has only one assumption, that of an independent error structure. Certain types of time-dependent data such as stock prices can violate this assumption. A pattern test has been devised that can detect a violation of this assumption. Change-Point Analyzer automatically performs this test any time you analyze a set of data. If a violation of this assumption is detected, the dialog box shown in Figure 1 will be displayed. This tutorial will describe how to handle such an event.
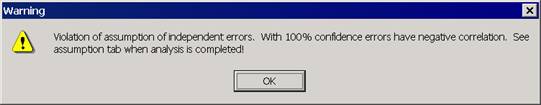
Figure 1: Dialog Box Warning of Violation of Assumption
A Problem Set of Data
Start Change-Point Analyzer. Type in the following series of numbers:
1 2 1 2 1 2 1 2 1 2
1 3 1 3 1 3 1 3 1 3
This data starts with alternating 1’s and 2’s and then switches to alternating 1’s and 3’s. Select the data and clicking on the Fast Analysis button. The dialog box shown in Figure 1 will be displayed indicating a violation of the assumption of independent errors. You are advised to read the Assumption tab when the analysis is completed. Click the OK button. When the analysis is completed display the Assumption tab shown in Figure 2.
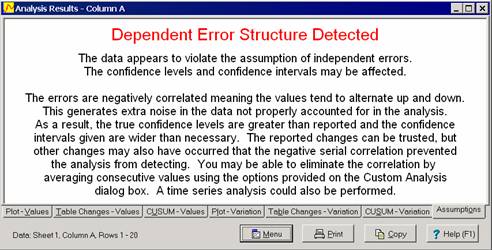
Figure 2: Assumption Tab Giving Further Details
The Assumption tab describes the problem, its implications and recommends possible solutions. In this case, the Assumption tab indicates that the data appears to be negatively correlated. Negative correlation means that if one value is above the average, the next value will tend to be below the average. This results in a bouncing up and down pattern, which is clearly evident in the plot in Figure 3.
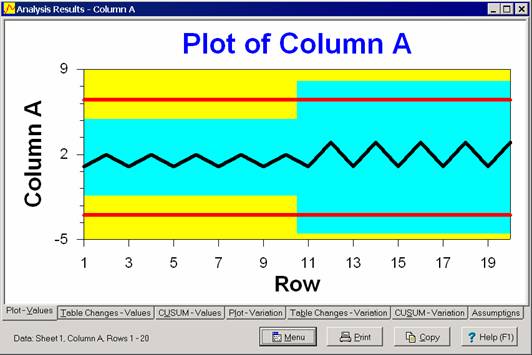
Figure 3: Plot of Data
The Assumption Tab indicates that the negative correlation generates extra noise or variation in the data, not properly accounted for in the analysis. This may have caused the analysis to miss some changes. Tab 2 indicates no shift in the average has been detected. However, a change might have occurred which the negative correlation caused us to miss.
The Assumption tab indicates that one option is to perform a time-series analysis. This is beyond the capabilities of Change-Point Analyzer. However, you are also given a second option. You might be able to eliminate the correlation by averaging consecutive values using the Custom Analysis dialog box.
Using Tab 3 of the Custom Analysis Dialog Box
Tab 3 of the Custom Analysis dialog box is used to help handle violations of assumptions. It is displayed in Figure 4. Tutorial 5 describes how to use the Ranks checkbox to handle outliers. Here we will learn how to use the Violation of Independent Errors Assumption radio buttons.
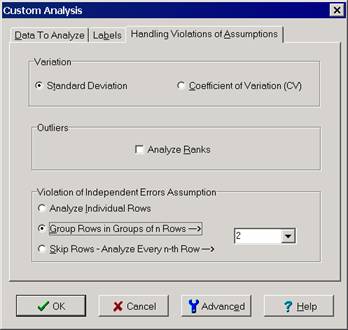
Figure 4: Handling Violation of Assumptions Tab of Custom Analysis Dialog Box
The Assumption tab recommended averaging consecutive values. In other words, the first two points should be averaged together, the third and fourth points averaged together and so on. This results in the following set of data:
1.5 1.5 1.5 1.5 1.5 2 2 2 2 2
Change-Point Analyzer will do this for you automatically if you click the middle radio button and entering 2 in the associated box (See Figure 4). Click the OK button to redo the analysis. This time, no violation of assumptions is detected. The results of the new analysis are shown in Figure 5. An upward shift in the average has been detected which was previously missed.
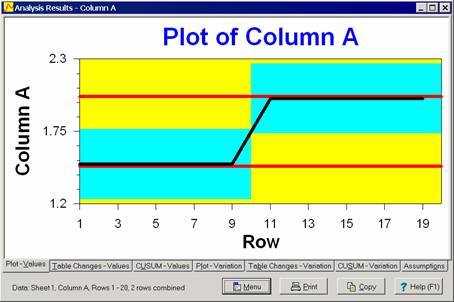
Figure 5: Results of Analysis with Consecutive Points Averaged
Positively Correlated Data
The previous example illustrated the case where the data is negatively correlated. A violation of assumptions can also occur due to positive correlation. A positive correlation means that if one value is above the average, the next several values will also tend to be above the average. A plot of such data appears to contain waves. An example is stock prices. A positive correlation has the opposite effect as a negative correlation. While a negative correlation can cause you to miss changes, positive correlations can cause you to falsely detect extra changes.
Again, averaging values using the Custom Analysis dialog box might eliminate the correlation and allow a correct analysis to be performed. With positively correlated data, you should average more than two points. The number of points should roughly correspond to the lengths of the waves. There is no guarantee that averaging points will remove the correlation. In which case, a time-series analysis is required.
Further information can be found in the article A Pattern Test for Distinguishing Between Autoregressive and Mean-Shift Data by Dr. Wayne A. Taylor.