Contents
- Index
Density and Distribution Functions of a Distribution
A distribution is a model for how a set of data is suppose to behave. It describes this behavior in terms of probabilities. This model is commonly described in terms of the density function.
Density functions for the normal distribution are shown below. They are essentially smoothed out histograms (where the width of the bars go to zero).
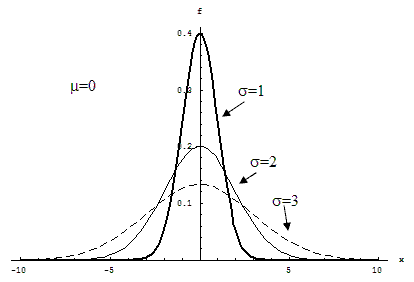
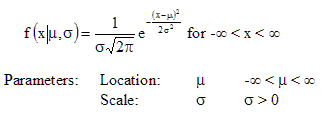
The mathematical form of the density function is:
Probabilities are obtained from the density function as areas under the curve. The probability that a data point is between 1 and 2 is the area under the density function between 1 and 2. For all density functions, the total area under the curve is one.
The distribution function F(x|parameters) is the probability of being £ x. It can be calculated from the density function as follows:
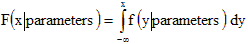
The equation is based on integrals. In plain English the distribution function F(x|parameters) is the area under the density function f(y|parameters) for y ranging from -infinity to x.