Contents
- Index
Tab 4: Order - Analysis
Tab 4 of the Test Distribution window displays the results of a change-point analysis to determine if there are shifts in the data over time. In order for this analysis to be performed, the order column must be filled out in the Data window. A plot of the data in time order is displayed on Tab 3: Order - Plot. If there are significant shifts, this tab will be bolded in the Test Distribution window.
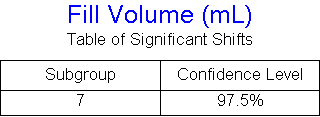
A change-point analysis can detect multiple shifts. If it detects shifts, the shifts are listed in a table. For each shift, the estimated first point or subgroup following the change is listed along with the confidence level representing the confidence that the shift occurred. Only shifts detected with 95% confidence or better are listed.
By performing a right mouse click over the graphic or clicking the Menu button, the following popup menu will appear:
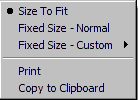
The menu items are as follows:
Size To Fit: Sizes output to fit window. Output will shrink and expand to fit window when window is resized.
Fixed Size - Normal: Sizes output so easy to read. If the output is too large to fit the window, scroll bars are added.
Fixed Size - Custom: Can specify the size of the output. If the output is too large to fit the window, scroll bars are added.
Print: Prints the output.
Copy to Clipboard: Copies the output to the clipboard in Windows Meta file (Picture) format.