Contents
- Index
AOQ Curve - Average Outgoing Quality Curve
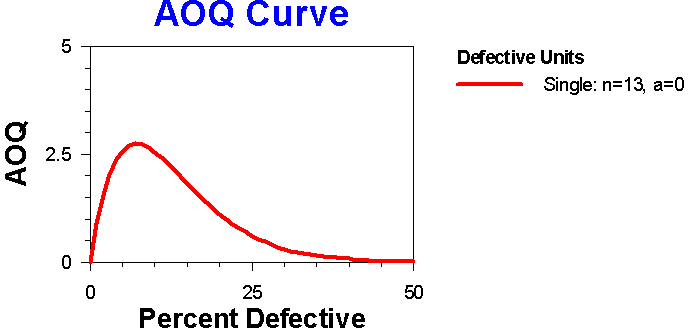
The AOQ curve shows how outgoing quality (y-axis) depends on the incoming quality (bottom axis). The average outgoing quality is only applicable to the characteristics defective units, defects per unit, and defects per quantity and assumes rejected lots are 100% inspected and all defectives/defects are removed.
The average outgoing quality is the average defective or defect rate in released lot assuming rejected lots are 100% inspected and all defectives/defects are removed. The outgoing quality is better than the incoming quality as a result of the 100% inspection of rejected lots. AOQ(p) = p x OC(p) where p is the defective/defect rate.
The AOQ curve initially increases as more defectives/defects are produced, more are released. As more and more lots are rejected, 100% inspections become more common and the AOQ curve starts to decrease as a result. The maximum value of the AOQ curve is called the Average Outgoing Quality Level (AOQL).