Contents
- Index
Normal Distribution
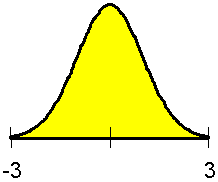
Variables Sampling Plans for Defective Units assume that a measurable characteristic is being inspected and that this characteristic follows the normal distribution. A histogram of such values should appear as a bell-shaped curve as shown above. Tables of the normal distribution exist which can be used to estimated the defective rate as a function of the relative distance from spec. These sampling plans are sensitive to the assumption of normality. A formal test for normality should be made before using these plans.