Contents
- Index
Stationary OC Curve
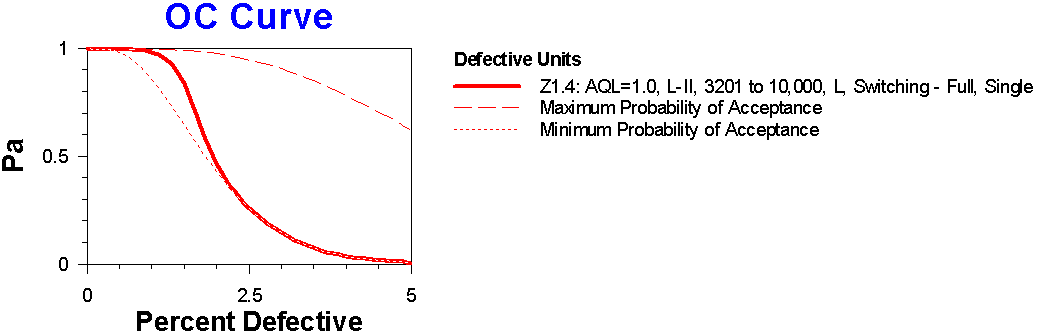
The stationary OC curve is calculated and displayed only when the protection varies. In this case the probability of acceptance is not constant. Instead it depends on other circumstances such as the quality of previous lots produced. For the ANSI Z1.4 plan shown above, the results of inspections of previous lots determines which of three sampling plans to use on the current lot.
The stationary OC curve shows the protection provided when a long series of similar quality lots are produced. The stationary OC curve is the middle of the three OC curves shown above. The stationary OC curve only describes the protection during periods of constant quality. It does not describe the protection during periods of changing quality. Instead the maximum OC curve and minimum OC curve describe the range of protection that can result when the lot quality is changing.
The stationary OC curve is used to determine the AQL and LTPD of a sampling plan when the protection varies. However, these two numbers do not fully summarize the protection provided. They should be supplemented with Max OC(LTPD) - Maximum Probability of Acceptance at LTPD, Min OC(AQL) - Minimum Probability of Acceptance at AQL, Rate of Convergence at LTPD, and Rate of Convergence at AQL.