Contents
- Index
X-Axis Tab of Plot Options Dialog Box
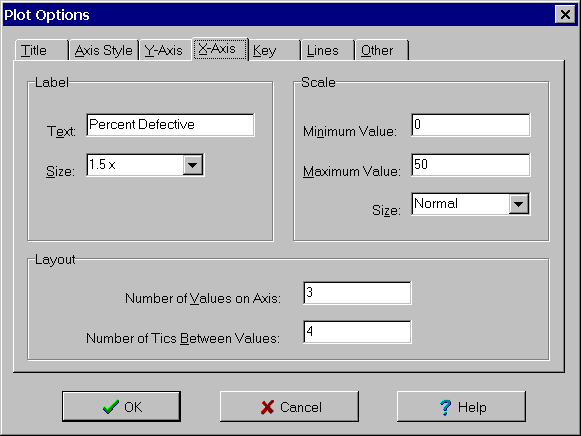
The X-Axis tab of the Plot Options dialog box is used to customize the label, scale and layout of the X-Axis on the bottom of the plot. The controls are:
Label:
Text Edit Box: Text to use for axis label. Leave blank if no label is desired.
Size Combo Box: Relative size of label. Default is 1.5 times normal text. Select one of the sizes in the list or enter a size.
Scale:
Minimum Value Edit Box: Value corresponding to left side of X-axis.
Maximum Value Edit Box: Value corresponding to right side of X-axis.
Size Combo Box: Relative size to display values along axis. Default is normal size. Select one of the sizes in the list or enter a size.
Layout:
Number of Values on Axis Edit Box: Controls number of values to display along axis. Minimum is 2.
Number of Tics Between Values Edit Box: Enter 0 for no tic marks between values.