Contents
- Index
Lines Tab of Plot Options Dialog Box
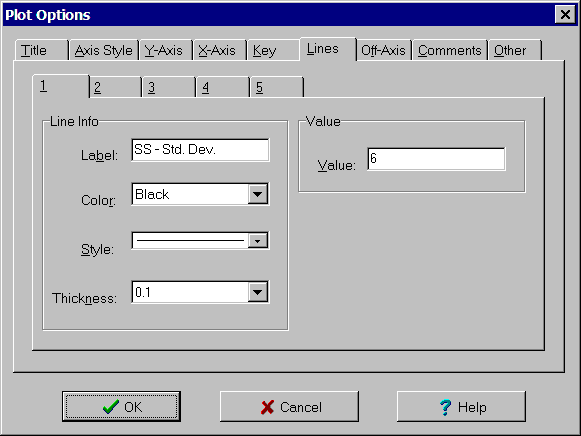
The Lines tab of the Plot Options dialog box is used to specify labels, color, style and thickness of each of the lines on the plot. For Interaction plots and contour plots, the value associated with the line can also be entered. The controls are:
Line tab: Select tab corresponding to desired line.
Line Info group:
Label edit box: Text to use for line label.
Color list box: Color for line. Select one of the colors in the list.
Style list box: Style for line. Select one of the styles in the list. Selecting any style except a solid line sets the thickness to hairline.
Thickness list box: Relative thickness of line. Hairline lines are one pixel wide. Selecting any thickness other than hairline sets the style to a solid line.
Value group: For interaction and contour plots only.
Value edit box: Value used for line.