Contents
- Index
Data Window
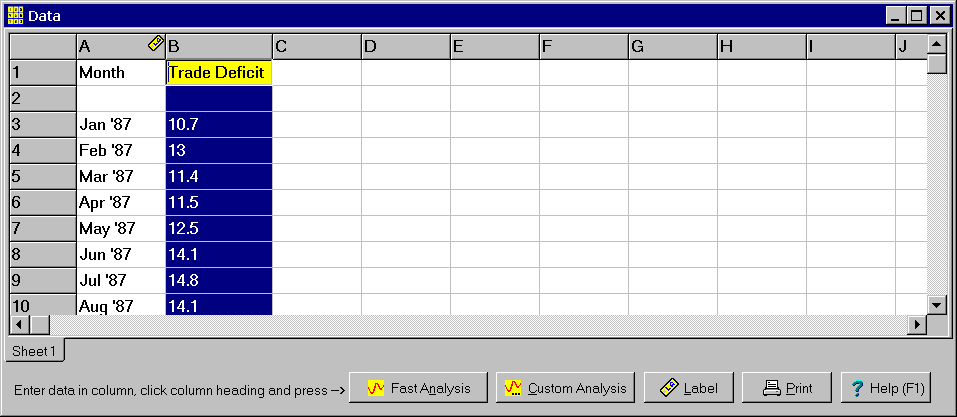
The Data window is a permanent child window that provides a spreadsheet for entering the data to be analyzed. The data can be entered in either rows or columns. You can also type the name of the variable at the beginning of the row or column. Another feature is that you can enter labels for the data points in a separate row or column.
Entering the Data: Either type the data in directly or paste it from the clipboard using the Paste menu item. Data can also be imported from a tab delimited text file using the Import Sheet menu item. The Edit menu contains menu items for cutting, copying, pasting, selecting and clearing spreadsheet cells as well as adding, deleting, moving and renaming sheets. Use the Tab, Shift+Tab, Enter, Page Up, Page Down, Home, End and arrow keys to move around the spreadsheet. Use the Shift+Arrow keys to increase or decrease the size of a selected region. Click on the Print button to print a copy of the data.
If there is a single observation per time period, enter all the data in a single column. You may skip some rows. If you have multiple observations per time period, enter the time periods in rows uses multiple columns to enter the individual values. You may have an unequal number of observations per time period. Alternatively, you can reverse rows and columns above.
Specifying Labels (Optional): Before performing the analysis, you can specify a column or row to be used for labels using the Labels button. To selected a column, click on the column header highlighting the entire column. Then click the Label button. An icon will be displayed in the column header to show that the column has been selected. To remove this selection, select any cell and click the label button. The selected column or row is used when performing a fast analysis. It also is used to initialize the Labels tab in the Custom Analysis dialog box. If labels are not specified, the row or column numbers are used as labels.
Performing the Analysis: Once the data is entered, it is time to perform the analysis.
Select the Data to Analyze. If the data is in a column, click the column header to select the entire column. If the data is in a row, click on the row header to select the entire row. Selecting the entire column or row results in all data being used. If you have multiple observations per time period, you should select multiple rows or columns. Do this but clicking on the first column header and while holding the mouse button down move the mouse cursor to the last column header before releasing the mouse button. If you want to select just part of the data for the analysis, drag the cursor over the cells to be analyzed.
Click the Fast Analysis or Custom Analysis Button. The Fast Analysis button will cause the data to be analyzed immediately using all default options. The Custom Analysis button displays a popup menu for selecting a custom analysis using the ranks, CV or both. It also provides a menu item for displaying the Custom Analysis dialog box for specifying further options before performing the change-point analysis.