Contents
- Index
Custom Analysis Dialog Box
The dialog contains three tabs. The first tab is used to select the data in the Data window to be used for the change-point analysis. An easier method of selecting the data is to highlight the data to be analyzed in the Data window first. The initial values of the controls on tab1 are based on what data was initially selected.
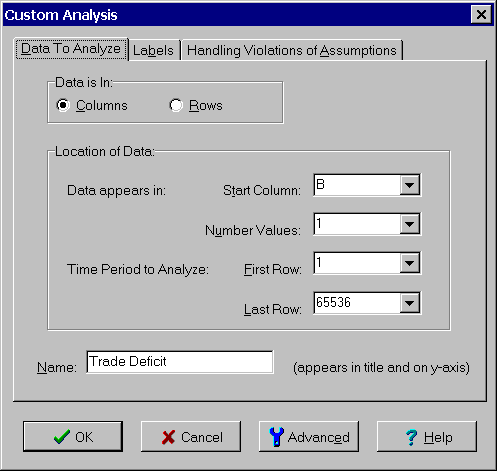
TAB 1: Data to Analyze
Data Is In Radio Buttons: Click the Column radio button if data resides in a column. Click the Row radio button if data resides in a row.
Start Column/Row Combo Box: Specify the first row column or row containing the data to be analyzed. Select the desired column or row from the associated list or type in the header of a row or column.
Number Columns/Rows Combo Box: Enter 1 if there is a single observation per time period. If there are multiple observations per time period, enter the number. The observations are expected to be consecutive starting with the column/row selected above.
First and Last Row/Column: Specify the fist and last row or column to be included in the analysis by either selecting them from the lists provided or by typing them in. These rows/columns correspond to different time periods.
Name (optional): Enter the name used to describe values analyzed. This name is displayed at the top of each of the plots and tables showing the results of the analysis. If no name is entered, the name of the row or column will be used as the title. For example, "Row 3" or "Column C".
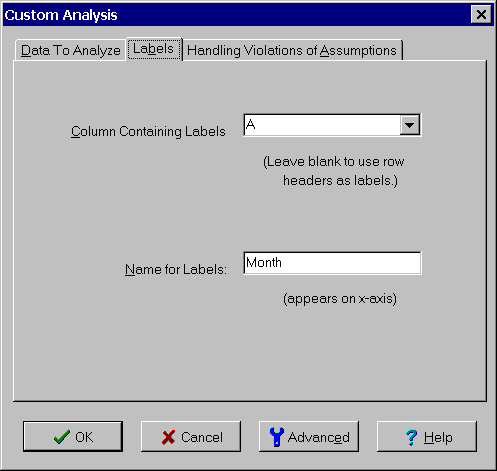
The second tab is used to specify labels for the data points if they exist.
TAB 2: Labels (optional)
Column/Row Containing Labels (optional): To specify labels for each point select a column or row. Leave blank to use the row or column headers as labels.
Name for Labels (optional): Enter a name for the labels. Otherwise leave blank.
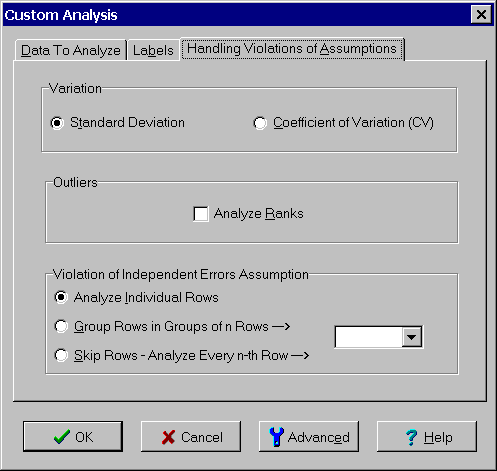
The third tab provides special options, some of which are used when violation of the assumptions are detected.
TAB 3: Handling Violation of Assumptions (optional)
Variation Radio Buttons: Select whether to analyze standard deviation or coefficient of variation (CV). The default is the standard deviation. When the variation tends to increase as the average increases, the variation can often be better represented by CV. One possible clue that this is the case is that a change-point analysis of the average and standard deviation show both shift in the same direction at approximately the same time.
Analyze Ranks Check Box: If checked, the ranks of the values are analyzed instead of the values themselves. Analyzing the ranks makes the analysis more robust to outliers. Outliers tends to increase the variation and may disguise certain changes. Analyzing the ranks reduces the effects of outliers and may allow shifts to be detected despite the outlier that might otherwise have been missed. If the program detects outliers, a message will be displayed on the assumption tab advising that this option be selected. However, even if no outliers are detected, certain types of data like particle/bioburden counts and test method CV, commonly have unusual values, will benefit from routinely using this analysis option.
Violation of Independent Errors Assumption Radio Buttons: The first option, Analyze Individual Row/Columns, is the default option. When this option is selected, each row/column represents a separate data point. However, when a violation of the assumption of independent errors is detected, the last two options can sometimes to be use to create a new data set which does not violate this assumption. The second option, Group Row/Columns in Groups of n Row/Columns, is the most common alternative. This option creates a new data set by averaging groups of n points. When a negative correlation is detected, n should be 2. When a positive correlation is detected, the group size should be chosen large enough to average out any waves seen in a plot of the data. This sometimes requires large groups of 5, 10 or more. The third option, Skip Rows/Columns - Analyze Every n-th Row/Column, creates a new data set by selecting every n-th point. This option does not generally does not work as well as the second option.
When done, click the OK button. If any errors are found, an error message will be displayed. The error must be corrected before proceeding. If no errors are found, the analysis is performed. Progress is reported in the Analysis Status dialog box. When the analysis is completed, the results are shown in the Analysis Results window.
If you want to verify or change the analysis options before performing the analysis, click the Advanced button. This displays the Advanced Options dialog box. To exit without performing an analysis, click the Cancel button or press the Esc key.