Contents
- Index
Analysis Results Window
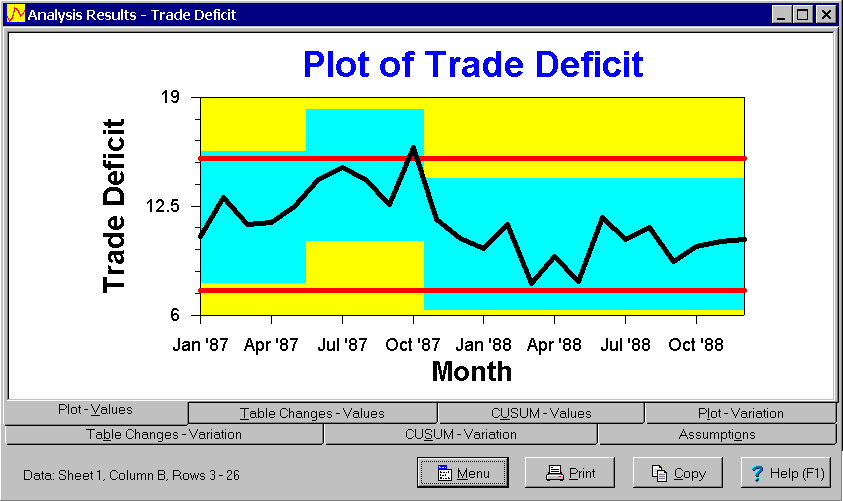
The Analysis Results window displays the results of the change-point analysis. The results appear on the 7 tabs shown below:
Tab 1: Plot - Values
Tab 2: Table Changes - Values
Tab 3: CUSUM - Values
Tab 4: Plot - Variation
Tab 5: Table Changes - Variation
Tab 6: CUSUM - Variation
Tab 7: Assumptions
Each tab has options that can be set. By performing a right mouse click over the graphic or clicking the Menu button, a popup menu will appear to set these options. Click the Print button to print the current tab and click the Copy button to copy the current tab to the clipboard.