Contents
- Index
Tab 6: CUSUM - Variation
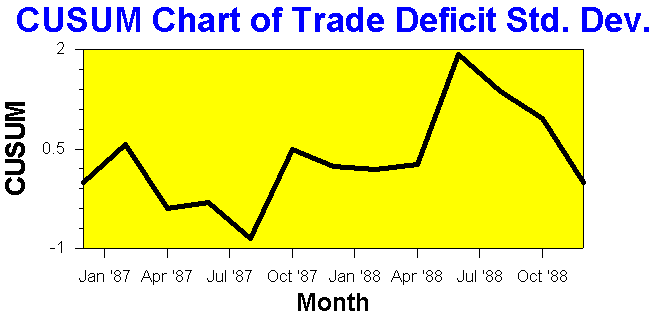
Tab 6 of the Analysis Results window displays a cumulative sum chart of the variation in time order like the one shown above. Tab 6 is similar to Tab 3 except Tab 6 shows the results for the variation and Tab 3 for the average. The changes in the variation detected by the change-point analysis are shown as changes in the background color. The CUSUM chart can provide additional insight into the changes for those skilled at interpreting such charts.
A CUSUM chart is interpreted as follows:
1. A shift in the variation appears as a change in direction on the CUSUM chart
2. A straight segment on a CUSUM represents a period where the variation remained constant
3. A downward slope indicates the variation is below the overall average.
4. An upward slope indicates a period that the variation is above the overall average
5. Sudden changes in direction represent sudden shifts in the variation
6. Gradual turns represent a period of transition of the variation from one level to another.
By performing a right mouse click over the graphic or clicking the Menu button, the following popup menu will appear:
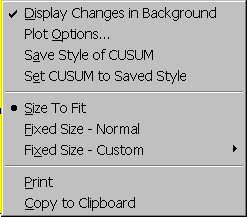
The menu items are as follows:
Displays Changes in Background: Displays changes in the variation on Tab 5. Changes are represented by changes in the background color. Selecting this menu item hides the changes.
Plot Options...: Displays Plot Options dialog box for changing the style and captions of the CUSUM chart. A short cut is to double click on the feature of the CUSUM chart one wants to change. For example, double click on the title displays the Plot Option dialog box with the Title tab showing.
Save Style of CUSUM: The style is set using the Plot Options menu item above. Selecting this menu item saves this style in the system registry. This allows this style to be quickly applied to other CUSUM charts.
Set CUSUM to Saved Style: The style is set using the Plot Options menu item and saved using the Save Style of CUSUM menu item above. Selecting this menu item sets the CUSUM chart to a previously saved style.
Size To Fit: Sizes CUSUM chart to fit window. CUSUM chart will shrink and expand to fit window when window is resized.
Fixed Size - Normal: Sizes CUSUM chart so easy to read. If the CUSUM chart is too large to fit the window, scroll bars are added.
Fixed Size - Custom: Can specify the size of the CUSUM chart. If the CUSUM chart is too large to fit the window, scroll bars are added.
Print: Prints the CUSUM chart.
Copy to Clipboard: Copies the CUSUM chart to the clipboard in Windows Meta file (Picture) format.