Contents
- Index
Tab 5: Table Changes - Variation
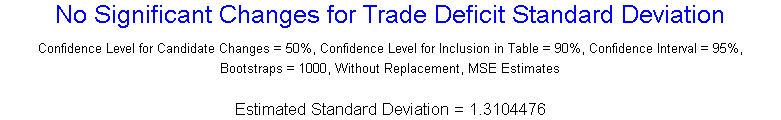
Tab5 of the Analysis Results window displays a table showing the changes in the variation found along with further information about each change. If no change is found, a message as shown above is displayed. Tab 5 is similar to Tab 2 except Tab 5 shows the results for the variation and Tab 2 for the average. The columns in the table are:
Estimated Time Of Change: The best estimate of when the change occurred.
Confidence Interval for Time of Change: An interval in which the change is likely to have occurred. The exact confidence is set using the Advanced Options dialog box and displayed at the top of the table. Care must be taken in interpreting this confidence interval. Suppose the default confidence of 95% is used. You can then state that with 95% confidence the true time of the change is within this interval. This means there is a 5% chance the change occurred outside this interval. However, the confidence interval only accounts for variability in the data. In reality, the chance of the change being outside the confidence interval is above 5% due to biases in the estimate causes by gradual changes, other undetected changes, etc.
Confidence Level of Change: The likelihood that the change occurred.
Average Before Change: Estimate of standard deviation or CV before change. Based on data back to previous change.
Average After Change: Estimate of standard deviation or CV after change. Based on data up to next change.
Level of Change: A level 1 change is the first change detected. The data is then split into two segments at the point of the change and each segment analyzed for additional changes. A change found in either segment is a level 2 change. Again the data is split and examined for level 3 changes and beyond. The level is an indication of the importance of the change with level 1 being most important. The level 1 change is generally the most visible change on the plot. Because of the backward elimination technique used, sometimes level 1 and 2 changes are later eliminated so do not appear.
The analysis options set using the Advanced Options dialog box and the Custom Analysis dialog box are documented at the top of the table.
By performing a right mouse click over the graphic or clicking the Menu button, the following popup menu will appear:
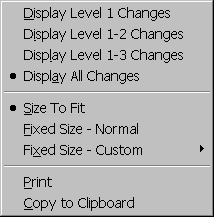
The menu items are as follows:
Displays Level 1 Changes: Displays only the level 1 change in the table. Selecting this option also affects the changes displayed on the plot in Tab 1, plot in Tab 4 and the CUSUM chart in Tab 6.
Displays Level 1-2 Changes: Displays only the level 1 and 2 changes in the table. Selecting this option also affects the changes displayed on the plot in Tab 1, plot in Tab 4 and the CUSUM chart in Tab 6.
Displays Level 1-3 Changes: Displays only the level 1 through 3 changes in the table. Selecting this option also affects the changes displayed on the Tab 1, plot in Tab 4 and the CUSUM chart in Tab 6.
Displays All Changes: Displays all detected changes in the table. Selecting this option also affects the changes displayed on the plot in Tab 1, plot in Tab 4 and the CUSUM chart in Tab 6. This is the default option.
Size To Fit: Sizes table to fit window. Table will shrink and expand to fit window when window is resized.
Fixed Size - Normal: Sizes table so easy to read. If the table is too large to fit the window, scroll bars are added.
Fixed Size - Custom: Can specify the size of the table. If the table is too large to fit the window, scroll bars are added.
Print: Prints the table.
Copy to Clipboard: Copies the table to the clipboard in Windows Meta file (Picture) format.