Contents
- Index
Tab 2: Transformed Data

Tab 2 of the Test Distribution window displays a histogram of the transformed values along with the density of the normal distribution. The equation used to transfer the data is shown at the top. Also shown are:
Moments: The sample size, average, standard deviation, skewness and kurtosis (or excess kurtosis) of the transformed values.
Test of Fit: Identical to Tab 1.
Capability Indexes: Identical to Tab 1.
Tolerance Interval: For transformed values. The inverse of the transformation equation is applied to this interval to obtain the tolerance interval in Tab 1.
Confidence Statement Associated With Spec Limits: Identical to Tab 1.
By performing a right mouse click over the graphic or clicking the Menu button, the following popup menu will appear:
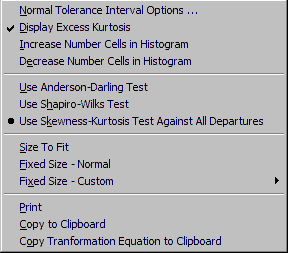
The menu items are as follows:
Tolerance Interval Options ...: Displays the Tolerance Interval Options dialog box for altering the confidence level, percentage in interval, type (upper, lower, 2-sided), units to use (% in spec, % out of spec, reliability) and whether to display tolerance interval only it the distribution fits.
Display Excess Kurtosis: If checked, the excess kurtosis is display. Otherwise the kurtosis is displayed..
Increase Number Cells in Histogram: Selecting this menu item increases the number of cells in the histogram meaning fewer values fall in each cell. This menu item can be selected multiple times. This menu item is grayed out (not available) when the histogram is such that every unique value is contained in its own cell.
Decrease Number Cells in Histogram: Selecting this menu item decreases the number of cells in the histogram meaning more values fall in each cell. This menu item can be selected multiple times.
Use Anderson-Darling Test: Selects Anderson-Darling test as general test for normality.
Use Shapiro-Wilks Test: Selects Shapiro-Wilks test as general test for normality.
Use Skewness-Kurtosis All Test: Selects Skewness-Kurtosis Specific test (Heavy Tails Towards Spec) as general test for normality.
Size To Fit: Sizes plot to fit window. Plot will shrink and expand to fit window when window is resized.
Fixed Size - Normal: Sizes plot so easy to read. If the plot is too large to fit the window, scroll bars are added.
Fixed Size - Custom: Can specify the size of the plot. If the plot is too large to fit the window, scroll bars are added.
Print: Prints the plot.
Copy to Clipboard: Copies the plot to the clipboard in Windows Meta file (Picture) format.
Copy Transformation Equation to Clipboard: Copies the equation for the transformation to the clipboard in EXCEL format.