Contents
- Index
Skewness-Kurtosis Plot Window
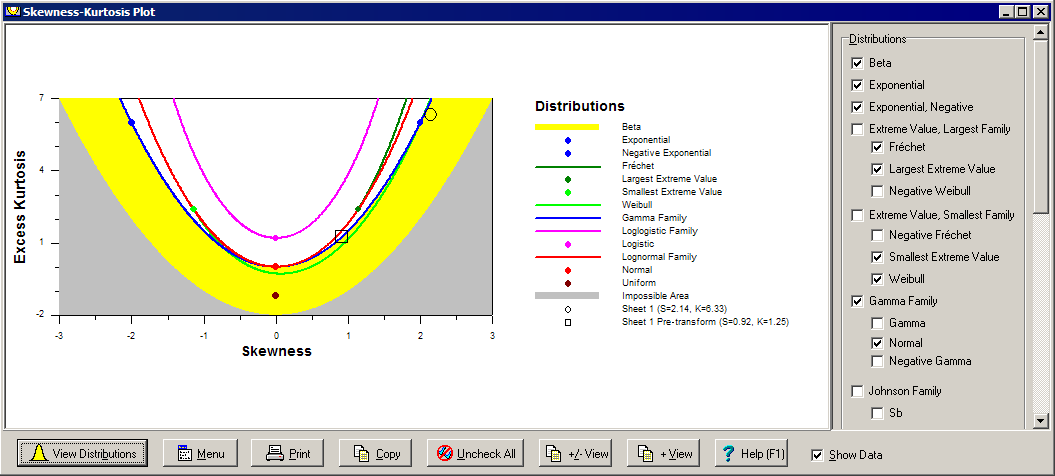
The Skewness-Kurtosis Plot window is a child window that displays a skewness-kurtosis plot for exploring the shapes and relationships of the different distributions. Use the Distributions panel at the right of the window to select which distributions and family of distribution to display. The skewness and kurtosis of any data entered in the Data window can also be displayed on the plot.
There are a number of buttons at the bottom on the window to alter, print and copy the skewness-kurtosis plot:
View Distributions Button: Displays the Select/View Distribution dialog box to find further information about the distributions including viewing the density function, calculating probabilities and determining bounds.
Menu Button: Displays popup menu below for customizing the plot. The first menu item selects whether to display the kurtosis or excess kurtosis on the left axis. The Plot Options menu item displays the Plot Options dialog box for altering the style, labels and axis of the skewness-kurtosis plot. These items can also be altered by double clicking on the plot itself.

Print Button: Prints the skewness-kurtosis plot. Same as clicking the Print button on the toolbar or selecting the Print menu item on the File menu.
Copy Button: Copies the skewness-kurtosis plot to the clipboard.
Uncheck All Button: Removes all checks from distributions in the Distributions panel in order to start over selecting distributions.
+/- View Button: Displays both the positive and negative skewness regions of the plot by setting the scale for the X-axis from -3 to 3 in the Plot Options dialog box.
+ View Button: Displays only the positive skewness region of the plot by setting the scale for the X-axis from 0 to 3 in the Plot Options dialog box.
Help Button: Displays help on using this window.
Show Data Check Box: When checked, points are displayed on the skewness-kurtosis plot representing data found on the tabs in the Data window. If lower or upper physical bounds are also specified, then points are also displayed representing the pre-transformed data.
To close the Skewness-Kurtosis Plot window, click the X in the upper right corner.
This window is displayed by selecting the View Skewness-Kurtosis Plot menu item, by clicking on the View Skewness-Kurtosis Plot button on the toolbar, or by clicking the Skewness-Kurtosis Plot button in the Data window.