Contents - Index
Capability Study Window
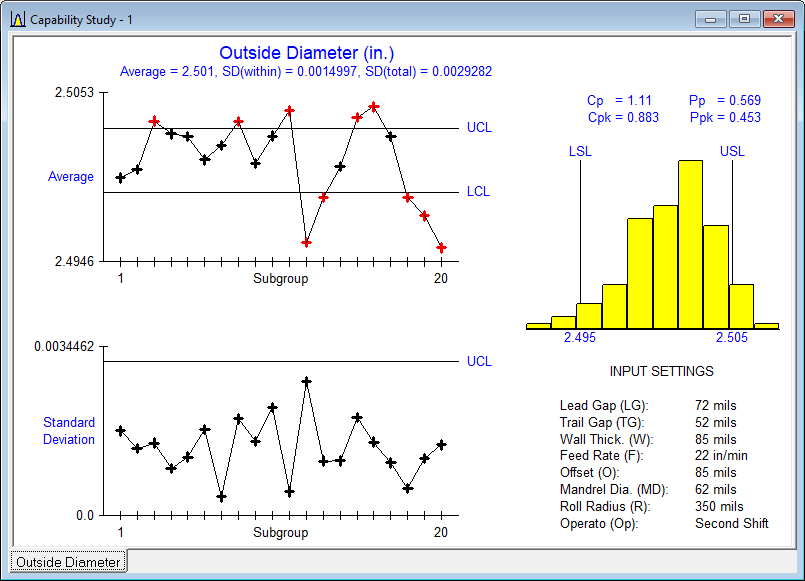
The Capability Study window displays the results of running a capability study. A capability study represents a larger study, taking 1 or more days to run where the inputs are set to the values specified on the Control Panel window and 20 trials are run spaced over time. Values of both the input and output variables are shown including a histogram, capability indices and control charts. To achieve Six Sigma Quality, all points should be within the control limits, Pp exceed 2 and Ppk exceed 1.5. For attribute data, the percent defective should be small such as below 0.1%. For some of the exercises it is not possible to achieve these values, in which case one should maximize Ppk or minimize the percent defective. Cp and Pp are only displayed when the output has both upper and lower spec limits. If their are multiple output variables, they are shown on separate tabs.
It is displayed by selecting the Capability Study button on the Control Panel window and by selecting the Perform Capability Study menu item on the Data menu or the associated toolbar button. The number of capability studies run is displayed on the status bar at the bottom the main window.
Pressing the F1 key displays this help page. Right clicking on the window displays the following popup menu:
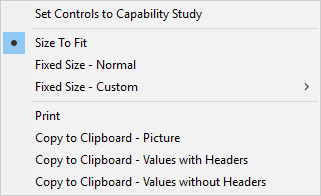
There are menu items to print and copy the graphic. The Print and Copy menu items on the File menu and toolbar perform the same function. There are also menu items for resizing the graphic.
The Set Control To Capability Study popup menu item sets the input variables in the Control Panel window to the values of the input variables shown in this window.
If this window is closed, it may be redisplayed using the Display/Set Controls for Capability Study menu item from the Data menu.