Contents
- Index
Statgraphics
VarTran will automatically convert equations from versions 4 and 5 of Statgraphics software package into the format required for either an output variable or objective function. This task is performed using the Paste Equation dialog box.
To obtain the equation from Statgraphics, first perform the response surface analysis. When the output is displayed, click the Tabular button shown below:

This displays the Tabular Options dialog box below:
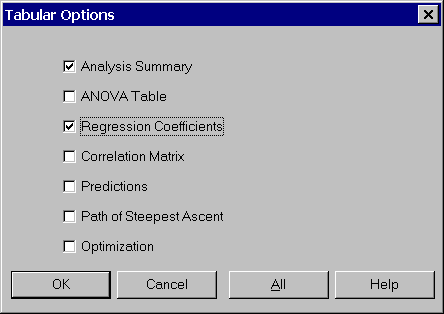
Check the Regression Coefficients check box and then the OK button to close the dialog box. Now find the equation in the Regression Coefficients pane. Highlight the equation by dragging the mouse over the equation and then select the Edit - Copy menu item to copy the equation to the clipboard.

It is now ready to be pasted into the Paste Equation dialog box.
The following conversions are performed automatically:
Variables are converted to valid symbols. Illegal characters are replaced by underscores and the symbol may be shortened. The original variable name from Statgraphics is preserved in the variable name field of VarTran when input variables are automatically created.
Numbers are converted from the e-format (1.25E-08) to the 10^ format (1.25 10^-8) used by VarTran.