Contents
- Index
Select Distribution to Fit Data Dialog Box
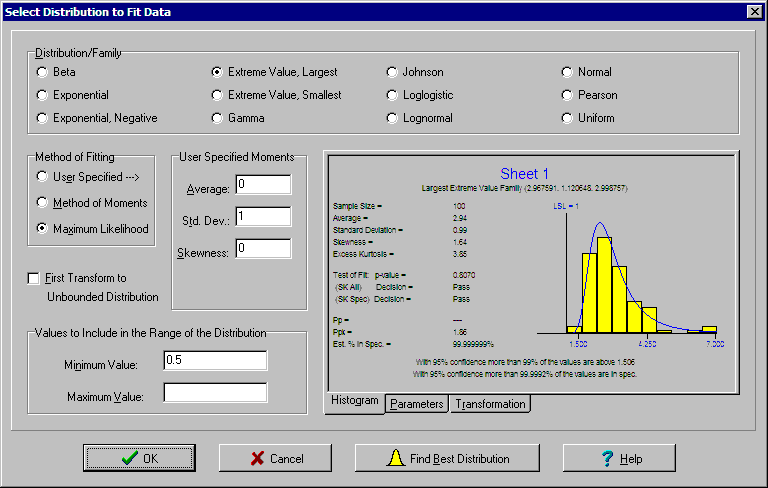
This dialog box is used to fit a distribution to the data in the currently selected tab in the Data window. This dialog gives you complete control over the process including the distribution to fit, the method used to fit the data and whether to pre-transform the data or not. The user is encouraged to use the Find Best Distribution button in the Data window instead. Selecting transformations has the potential of being abused. The distribution that best fits the data is generally the one that should be used.
The following options can be set:
Distribution/Family Radio Group: Select the distribution or family of distributions to use from the list. The following are available: beta, exponential, negative exponential, largest extreme value, smallest extreme value, gamma, Johnson, loglogistic, lognormal, normal, Pearson and uniform.
Method of Fitting Radio Group: Used to select method of fitting data to selected distribution. There are three options: (1) enter user specified moments, (2) method of moments and (3) maximum likelihood method. The user specified moments approach uses the moments entered in the User Specified Moments group to determine the parameters of the distribution and completely ignores the data. The other two approaches use the data to estimate the parameters of the distribution.
User Specified Moments Group: Used to enter up to four moments depending on the distribution. All distributions require the first two moments (average and standard deviation). Many also require the skewness. A few also require the kurtosis. These moments are only used when the User Specified radio button is selected in the Method of Fitting radio group.
Average Edit Box: First moment required for all distributions. Must be a real number.
Standard Deviation Edit Box: Second moment required for all distributions. Must be a real number greater than zero.
Skewness Edit Box: Third moment. Only displayed for certain distributions. Can be any real number except for the largest extreme value (> -5.6051382), smallest extreme value (< 5.6051382) and loglogistic (> -4.284783 and < 4.284783).
Kurtosis/Excess Kurtosis Edit Box: Fourth moment. Only displayed for certain distributions. Enter either the kurtosis or excess kurtosis depending on which is selected in the Analysis Options dialog box. The kurtosis must be a real number greater than 1.0 and satisfying Kurtosis > Skewness * Skewness + 1. The excess kurtosis must be a real number greater than -2.0 and satisfying Excess Kurtosis > Skewness * Skewness - 2.
First Transform to Unbounded Distribution Check Box: Checking this box pre-transforms the data using the Lower and/or Upper bounds of the currently selected tab in the Data window. If no bounds are provided, this box is grayed out.
Minimum Value Edit Box: Specifying a minimum value forces the distribution to include this value in the range of the fitted distribution. It may be left blank. The value has no affect on unbounded distributions but does affect bounded distributions. This value is by default set to one standard deviation below the lower spec limit, if one exists, to ensure the lower spec limit is within the range of the distribution fit to the data. This ensures the lower spec limit can be transformed along with the data.
Maximum Value Edit Box: Specifying a maximum value forces the distribution to include this value in the range of the fitted distribution. It may be left blank. The value has no affect on unbounded distributions but does affect bounded distributions. This value is by default set to one standard deviation above the upper spec limit, if one exists, to ensure the upper spec limit is within the range of the distribution fit to the data. This ensures the upper spec limit can be transformed along with the data.
A picture of the distribution fit to the data is displayed if the selected approach can fit the data. Otherwise, an error message is displayed. The parameters of the distribution are given on the second tab. The corresponding transformation in EXCEL format is displayed on the third tab. Right clicking the mouse while the cursor is over one of these tabs displays a popup menu for printing the graphic or copying it to the clipboard.
Click the Find Best Distribution button to determine which of the available distributions best fits the data with or without pre-transforming the data. The distribution producing the highest p-value for the Skewness-Kurtosis All Test for normality when applied to the transformed data is selected. This button attempts to return a distribution that covers the specified range but, in certain cases, the method of moments approach may best fit a distribution that does not cover the range.
When done, click the OK button. If any errors are found, an error message will be displayed and the errors must be corrected before the dialog box can be closed. To exit without changing the distribution, click the Cancel button or press the Esc key.
This dialog box is displayed by clicking Select Distribution button in the Data window and then selecting the Custom menu item.