Contents
- Index
Analysis Menu
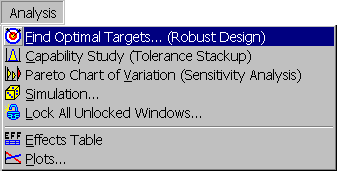
Third item on menu bar containing the following menu items:
 Find Optimal Targets...: Robust Design Option. Displays
 Find Optimal Targets dialog box for determining optimal targets. Shortcut is button on toolbar.
 Capability Study: Tolerance analysis option. Performs capability study on the selected output assuming inputs are at their current targets. Shows results in a
 Capability Study window. Shortcut is button on toolbar.
 Pareto Chart of Variation: Sensitivity analysis option. Draws Pareto chart of the contributions of the individual inputs to the total variation for the selected output. Assumes the inputs are at their current targets. Shows results in a
 Pareto Chart window. Shortcut is button on toolbar.
 Simulation...: Displays
 Simulation dialog box for performing simulation of all outputs assuming inputs are at current targets. Shortcut is button on toolbar.
 Lock All Unlocked Windows...: Locks all unlocked Capability Study, Pareto Chart and Summary Table windows. First displays
 Note for Windows Being Locked dialog box for entering a note to add to the windows being locked. Shortcut is button on toolbar.
 Effects Table: Draws effects table for the selected output. Shows result in
 Effects Table window. Shortcut is button on toolbar.
 Plots...: Displays
 Plots dialog box for displaying plots of the effects of the inputs on the outputs. Shortcut is button on toolbar.
When clicking on the Capability Study, Pareto Chart or Effects Table menu items, a popup menu will appear for selecting the output to analyze whenever there is more than one output variable and objective function.