Contents
- Index
Capability Study Window
The Capability Study window is a child window for displaying detailed information about the predicted performance of an output variable or objective function. The results displayed in this window are the results of performing a tolerance analysis. It is displayed by clicking on the  button on the toolbar or by selecting the Capability Study menu item from the
 Analysis menu. Click on the X in the upper right corner to close this window.
The Capability Study window automatically updates itself when information affecting the displayed results is changed. When the program is in immediate update mode, the updates occur immediately following the change being made. If the program is in delayed update mode, the Capability Study window draws a red X through itself when it is not current. Clicking on the window will cause it to update and redraw itself. The update mode is selected using the Options menu.
Double clicking on the variable name or symbol in the window results in the appropriate variable dialog box being displayed so that the variable can be edited. This is a short cut to selecting the Edit menu item from the Variables menu.
There are three tabs displaying the following information:
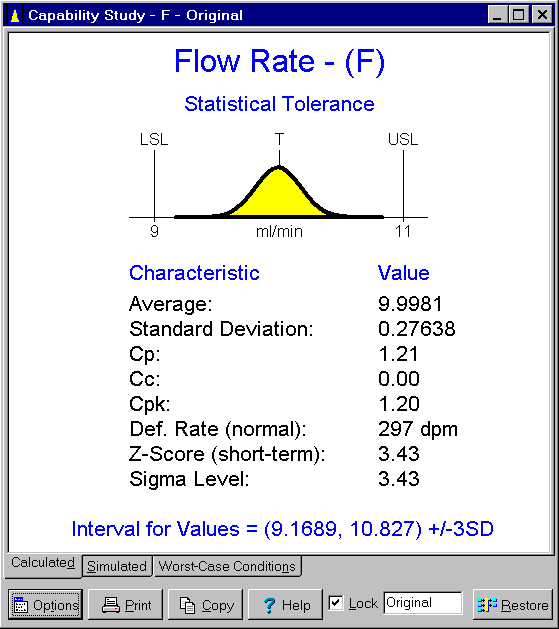
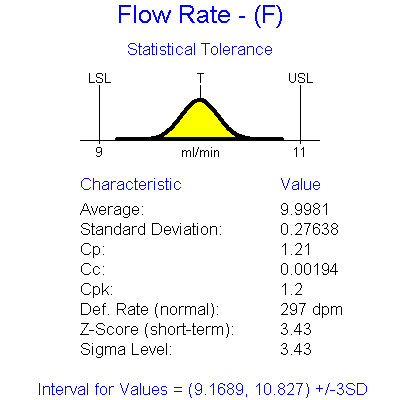
Tab 1 - Calculated: Displays the results of the tolerance stack-up done using analytic methods. When statistical or process tolerancing is required, equations for standard deviations are derived instead of simulated. Approximations are involved but all methods of tolerancing are supported.
Tab 2 - Simulated: Displays the results of the tolerance stack-up done using Monte-Carlo simulation. Perhaps the best approach for statistical tolerances, it is not applicable to worst-case tolerances. Simulation results are shown for process tolerances, but the worst-case conditions are identified using analytic methods first. Before simulation results are displayed, a simulation must be done using the Simulation menu item on the Analysis menu.
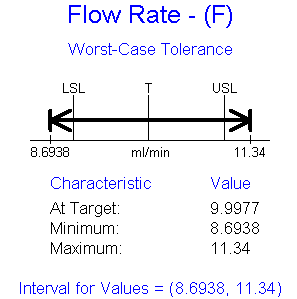
Tab 3 - Worst-Case Conditions: Displays targets for the inputs that result in the worst-case conditions. Only applicable to worst-case and process tolerances. For worst-case tolerances, the values of the inputs shown are those generating the minimum and maximum values for the output. For process tolerances, the values of the inputs shown are the targets for the inputs generating the minimum and maximum average for the output.
Worst-Case Tolerancing: The results displayed on tabs 1 and 2 depends on the type of tolerancing performed. When worst-case tolerances are entered for the inputs, the resulting tolerance for the output will also be a worst-case tolerance as shown below. Displayed are the minimum and maximum values that the output can take on as the inputs vary over their worst-case intervals. Also shown is the value of the output when the inputs are set to their targets.
Statistical Tolerancing: When statistical tolerances are entered for the inputs, the resulting tolerance for the output will also be a statistical tolerance as shown below. Displayed are the resulting average and standard deviation. These are used to calculate Cp, Cc, Cpk, defect rate, Z-Score, sigma level and interval for values. The defect rate shown on Tab 1 assumes the output variable follows the normal distribution. Some of these values may not be displayed if the necessary specification limits and targets values are not entered in the Output Variable dialog box. The results assume the inputs are centered at their specified targets.
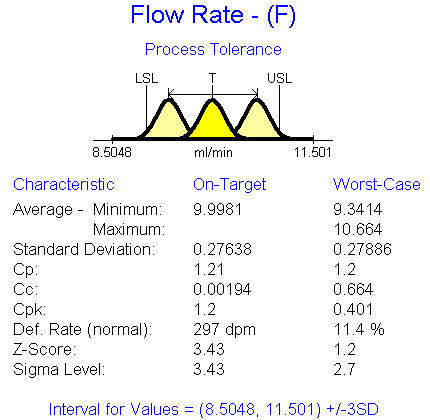
Process Tolerancing: When process tolerances are entered for the inputs or when worst-case and statistical tolerances are mixed, the resulting tolerance for the output will be a process tolerance as shown below. Displayed are the minimum and maximum average and maximum standard deviation that can result. These are used to calculate Cp, Cc, Cpk, defect rate, Z-Score, sigma level and interval for values. The defect rates shown on Tab 1 assume the output variable follows the normal distribution. Some of these values may not be displayed if the necessary specification limits and targets values are not entered in the Output Variable dialog box. Along side the worst-case results are the values one would expect if all inputs where centered at their targets. The on-targets values are obtained by performing a statistical stack-up ignoring any worst-case tolerances and operating windows for the average.
For objective functions, the minimum and maximum values over the worst-case tolerances are displayed. If no worst-case tolerances are specified, the value is displayed instead.
The buttons and controls at the bottom can be hidden by removing the check from the Show Buttons menu item on the Options menu. When hidden, the popup menu can still be used to perform the functions of these buttons and controls. The following buttons and controls are available:
 Clicking this button displays the popup menu below associated with this window. This popup menu has menu items that correspond to each of the buttons and controls shown at the bottom of the window. It also has items that can be used to change how the graphic is sized within the window. A short cut is to right mouse click on the graphic.

 Prints the graphic on the selected tab. Shortcuts are to click the Print button on the toolbar or to select the Print menu item on the
 File menu.
 Copies the graphic on the selected tab to the clipboard. Shortcuts are to click the Copy to Clipboard button on the toolbar or to select the Copy to Clipboard menu item on the
 File menu.
 Displays help on using this window. Short cut is to press F1 key.
Lock check box: Checking this box locks the window so that it does not update as changes are made to the variables. Locking the window causes a complete copy of the I/O System to be saved. It also causes the Restore button to be displayed which can be used to restore the I/O System to the state it was in when the Lock check box was clicked. Unlocking a window deletes the saved copy of the I/O System.
Note edit box: Used to enter a note that appears on the caption bar. Primarily intended to be used when the window is locked to describe the version of the design being displayed.
 This button is only displayed when the window is locked. Clicking it restores the I/O System to the exact state it was in when this window was locked.