Contents
- Index
Effects Table Window
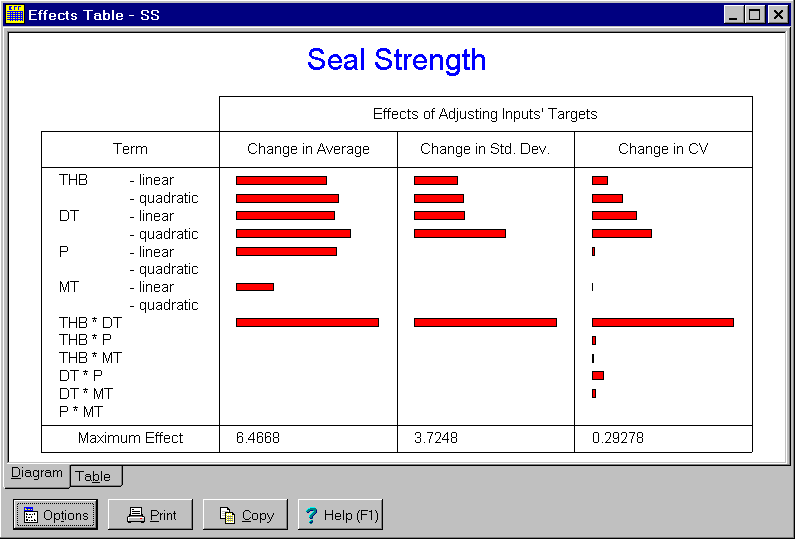
The Effects Table window is a child window used to display the effects that changing the targets of individual inputs has on the average, standard deviation and CV of the selected output variable or the value of the selected objective function. It is displayed by clicking on the  button on the toolbar or by selecting the Effects Table menu item from the
 Analysis menu. Click on the X in the upper right corner to close this window.
The Effects Table window automatically updates itself when information affecting the displayed results is changed. When the program is in immediate update mode, the updates occur immediately following the change being made. If the program is in delayed update mode, the Pareto Chart window draws a red X through itself when it is not current. Clicking on the window will cause it to update and redraw itself. The update mode is selected using the Options menu.
Double clicking a variable name or symbol in the window results in the appropriate variable dialog box being displayed so that the variable can be edited. This is a short cut to selecting the Edit menu item from the Variables menu.
There are two tabs displaying the same information to two different formats:
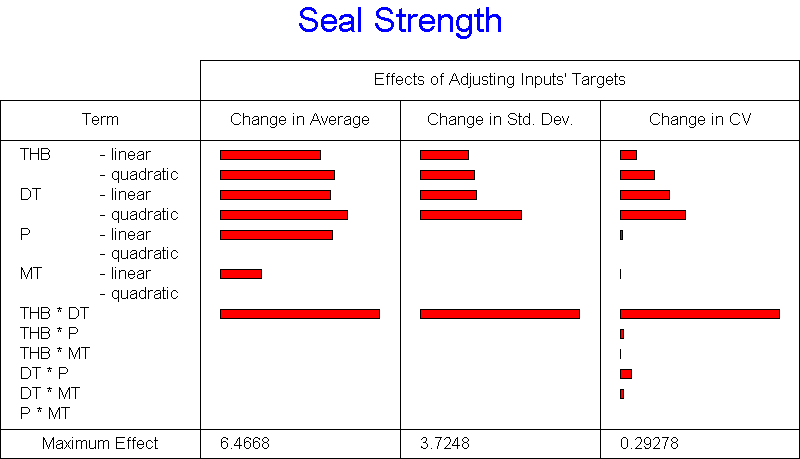
Tab 1 - Diagram: Graphically displays the results that changing the targets of individual inputs has on the average, standard deviation and CV of the selected output variable or the value of the selected objective function. The longer the bar, the greater the effect. For exact values, see the second tab.
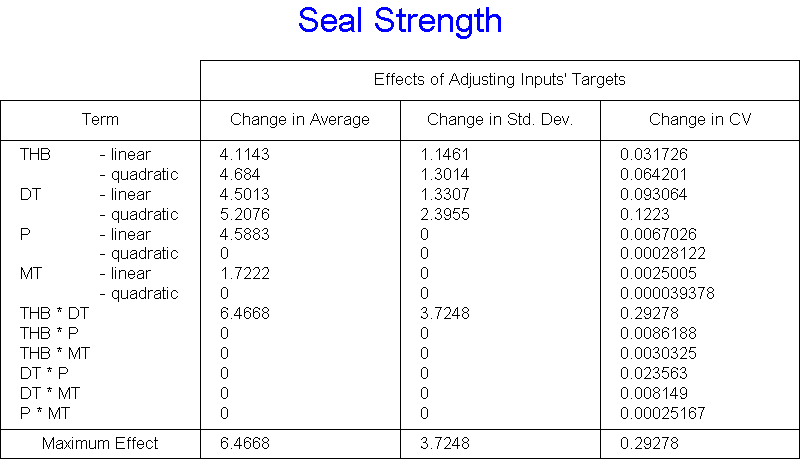
Tab 2 - Table: Displays in tabular form the results that changing the targets of individual inputs has on the average, standard deviation and CV of the selected output variable or the value of the selected objective function. To determine the effects of the input's targets, the output's average, standard deviation and CV are calculated repeatedly over the region determined by the minimum and maximum targets in the Continuous Input Variable dialog box. Both linear and quadratic effects are calculated for each input as well as interaction effects for all possible interactions between two inputs. These interaction effects are denoted with an * separating the symbols of the two inputs. An interaction between two variables is when their combined effect either exceeds or is below their individual effects. These effects are used to construct the graphic on Tab 1.
Achieving robust designs requires identifying input's whose targets affect the output's standard deviations or CV's. The targets of these inputs are generally set to minimize the variation. The targets of the other inputs are then set to achieve the desired average. Based on the effects table, one can determine which inputs affect the variation, which affect the average and which have the largest effects. This helps to determine which plots will be most useful in understanding the effects of the inputs on the output.
The buttons and controls at the bottom can be hidden by removing the check from the Show Buttons menu item on the Options menu. When hidden, the popup menu can still be used to perform the functions of these buttons and controls. The following buttons and controls are available:
 Clicking this button displays the popup menu below associated with this window. This popup menu has menu items that correspond to each of the buttons and controls shown at the bottom of the window. It also has items that can be used to change how the graphic is sized within the window. A short cut is to right mouse click on the graphic.

 Prints the graphic on the selected tab. Shortcuts are to click the Print button on the toolbar or to select the Print menu item on the
 File menu.
 Copies the graphic on the selected tab to the clipboard. Shortcuts are to click the Copy to Clipboard button on the toolbar or to select the Copy to Clipboard menu item on the
 File menu.
 Displays help on using this window. Short cut is to press F1 key.