Contents
- Index
Evaluation Window
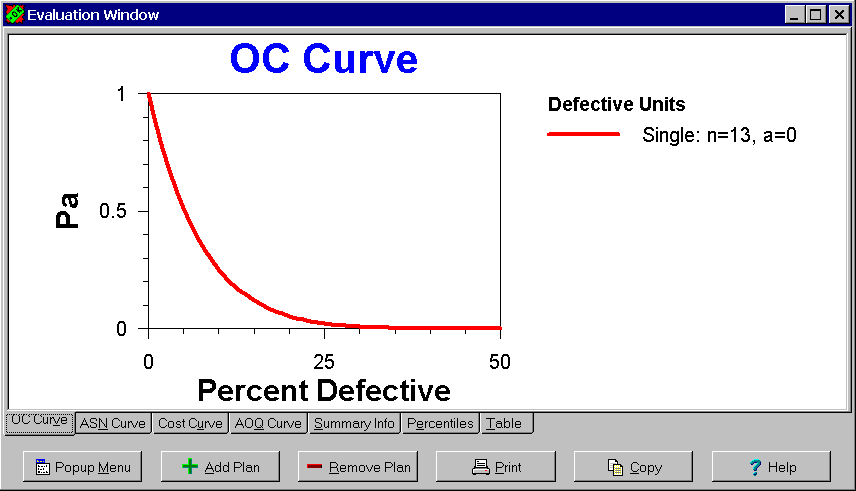
The Evaluation window displays OC curves, ASN curves and other information about the selected sampling plans. The results appear on the 7 tabs shown below:
TAB 1: OC Curve:
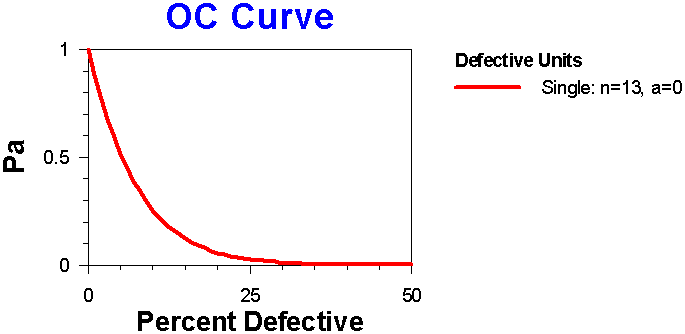
Displays a plot of the Operating Characteristic (OC) curve. The Display Worst-Case OC Curves menu item on the popup menu can be used to control whether, for those sampling plans whose protection varies, the minimum and maximum OC curves are displayed along with the stationary OC curve.
TAB 2: ASN Curve:
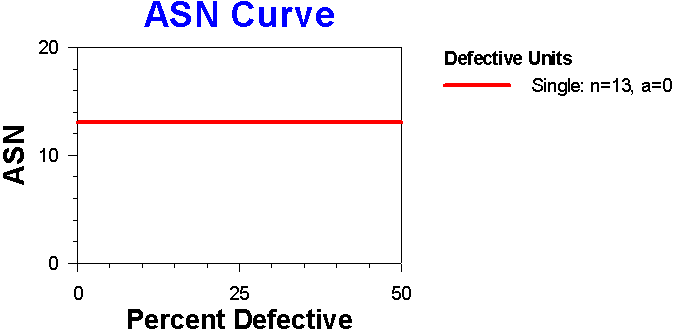
Displays a plot of the Average Sample Number (ASN) curve.
TAB 3: Cost Curve:

Displays a plot of the Cost curve. The Cost Parameters menu item on the popup menu can be used to display the Cost Parameters dialog box in order to change the values of the two cost parameters used in constructing the cost curve.
TAB 4: AOQ Curve:
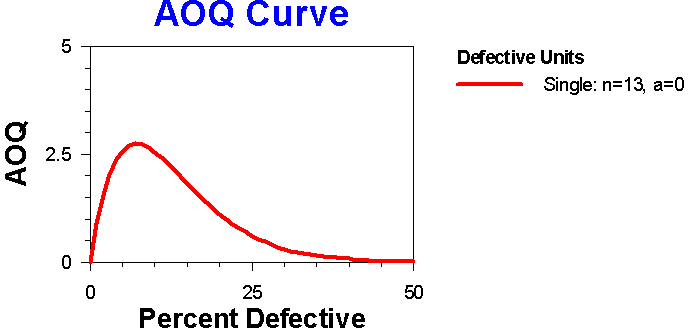
Displays a plot of the Average Outgoing Quality (AOQ) curve when applicable.
TAB 5: Summary Information:

Displays a table giving the AQL, LTPD, AOQL of the sampling plans and indicating if the protection is constant or varies.
TAB 6: Percentiles:

Displays a table giving 9 different percentiles of the sampling plans.
TAB 7: Table:
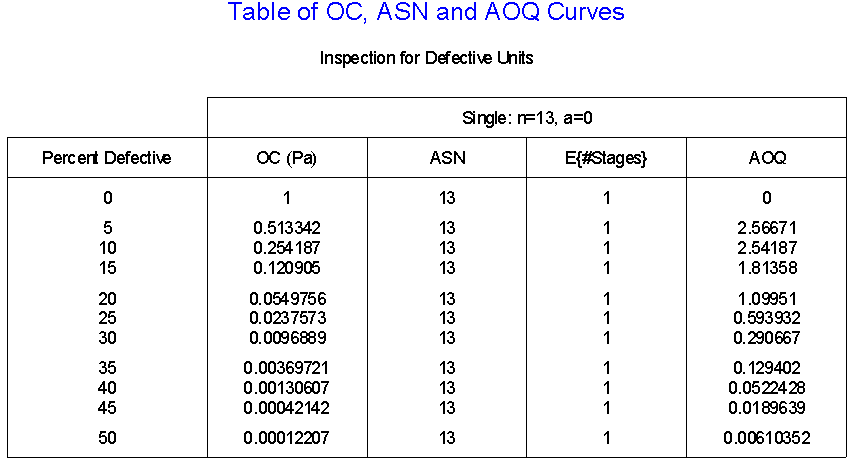
Displays a table of values for the OC, ASN, Cost and AOQ curves. The Table Range menu item on the popup menu can be used to display the Table Range dialog box in order to control the number of rows in this table.
The buttons at the bottom can be used to add and delete sampling plans from the plots and tables, print and copy the results and display the popup menus with other options:
 Displays the popup menu associated with the current tab. An alternative is to right mouse click while over the plot or table part of the tab. All the popup menus have items for controlling how the graphic is sized and for printing and copying the graphic. The popup menus associated with the plots also has a Plot Options menu item for customizing the plot. The popup menus for some of the tabs have additional menu items specific to that tab.
 Displays the
 Add Selected Sampling Plans dialog box for selecting additional sampling plans to be added to the plots and tables. An alternative is to drag a sampling plan from the List Sampling Plans window.
 Displays the
 Remove Selected Sampling Plans dialog box for selecting which sampling plans to remove from the plots and tables.
 Prints plot or table on the displayed tab. Alternatives are to click the Print button on the toolbar or select the Print menu item on the
 File menu.
 Copies the plot or table on the displayed tab to the clipboard. Alternatives are to click the Copy to Clipboard button on the toolbar or select the Copy to Clipboard menu item on the
 File menu.
 DIsplays help. An alternative is pressing the F1 key.


